West Antarctica: still warming
The temperature reconstruction of O’Donnell et al. (2010) confirms that West Antarctica is warming — but underestimates the rate
Eric Steig
At the end of my post last month on the history of Antarctic science I noted that I had an initial, generally favorable opinion of the paper by O’Donnell et al. in the Journal of Climate. O’Donnell et al. is the peer-reviewed outcome of a series of blog posts started two years ago, mostly aimed at criticizing the 2009 paper in Nature, of which I was the lead author. As one would expect of a peer-reviewed paper, those obviously unsupportable claims found in the original blog posts are absent, and in my view O’Donnell et al. is a perfectly acceptable addition to the literature. O’Donnell et al. suggest several improvements to the methodology we used, most of which I agree with in principle. Unfortunately, their actual implementation by O’Donnell et al. leaves something to be desired, and yield a result that is in disagreement with independent evidence for the magnitude of warming, at least in West Antarctica.
 In this post, I’ll summarize the key methodological changes suggested by O’Donnell et al., discuss how their results compare with our results, and the implications for our understanding of recent Antarctic climate change. I’ll then try to make sense of how O’Donnell et al. have apparently wound up with an erroneous result.
First off, a reminder for those not familiar with it: the essential innovation in our work was to combine the surface temperature data available from satellites with the ~50 years of data from weather stations. The latter are generally considered more reliable and go back a full 50 years, but are very sparse and incomplete, whereas the satellite data provide complete spatial coverage of the continent, but only since the early 1980s. We combined the two data sets by calibrating the weather station data against the satellite data, and using the calibration to get a complete spatial picture of Antarctic temperature variability and trends for the last 50 years. The key findings were that the overall Antarctic trend was positive (but not necessarily statistically significant), and that in West Antarctica, the trends were both positive and significant, especially in winter and spring. These findings were important enough for Nature to publish them because most researchers thought that significant warming was restricted only to the Antarctic Peninsula region. None of these findings is contradicted by O’Donnell et al.’s results.
O’Donnell et al. have three main criticisms of our work. First, that the reconstruction we reported was not homogenous. That is, the first part of the reconstruction (1957 through 1981) is based entirely on a linear combination of weather station data (since there are no satellite data during that period); while the second part (1982-2006) is derived simply from the satellite data. O’Donnell et al argue that it would be better to use the only weather station data for both periods, since these data are a priori considered more reliable. (There are all sorts of potential problems with the satellite data, the chief one being that there is a ‘clear sky’ bias.) That is, one wants to calibrate the data during 1982-2006, and then use that calibration to model the temperature field for both the early and the later periods, using only the weather stations.
Second, that in doing the analysis, we retain too few (just 3) EOF patterns. These are decompositions of the satellite field into its linearly independent spatial patterns. In general, the problem with retaining too many EOFs in this sort of calculation is that one’s ability to reconstruct high order spatial patterns is limited with a sparse data set, and in general it does not makes sense to retain more than the first few EOFs. O’Donnell et al. show, however, that we could safely have retained at least 5 (and perhaps more) EOFs, and that this is likely to give a more complete picture.
Third, O’Donnell et al. argue that we used too low a truncation parameter when doing the ‘truncated least squares’ regressions. In general, using too low a truncation parameter will overly smooth the results, and tend to smooth both temporal and spatial information. The problem with using too large a truncation parameter is that it creates problems when data are sparse, resulting in numerical noise (overfitting). O’Donnell et al. try to get around this problem by using cross validation — that is, trying a bunch of different truncation parameters, and using the ones that give the maximum r2, RE and CE statistics.
There are a number of other criticisms that O’Donnell et al. make, such as whether it is okay to infill the weather station data at the same time as doing the calibration against the satellite data (as we did) or whether these have to be done separately (as O’Donnell et al. did). These are more technical points that may or may not be generally applicable, but in any case do not make a significant difference to the results at hand (as O’Donnell et al. point out).
Let’s assume, for the moment, that all of these ideas are on the mark, and that the main reconstruction presented by O’Donnell et al. is, in fact, a more accurate picture of Antarctic temperature change in the last 50 years than presented in previous work. What are the implications for Antarctic climate? How would they differ what was concluded in Steig et al. (2009)? The answer is: very little.
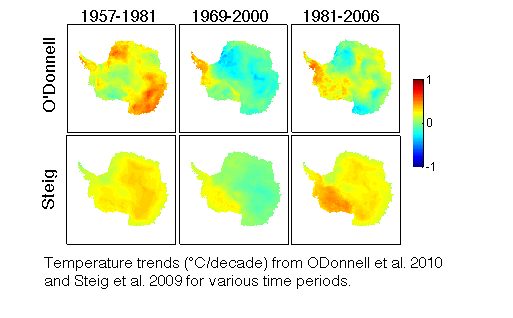
The spatial patterns of annual trends, and how they evolve through time, is similar in both papers. In particular, O’Donnell et al. find, as we did, that the entire continent was warming, on average, prior to early 1980s (Figure below from their main “RLS” reconstruction). As we said in our paper, this would tend to support the idea that cooling in East Antarctica is a recent phenomenon at least in part attributable to recent trends in the Southern Annular Mode (SAM), which is itself forced (at least in part) by stratospheric ozone depletion.
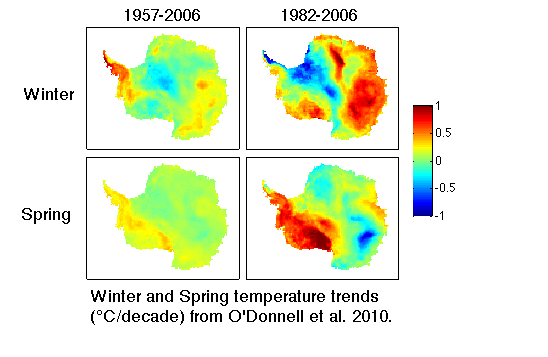
O’Donnell et al. also reproduce our finding that the seasons in which the most rapid and significant warming is occurring are winter and spring — in large areas of both East Antarctica and West Antarctica. In spring, warming is significant throughout all of West Antarctica through the entire 50 years of the record, and in winter, it also occurs throughout all of West Antarctica in the last 25 years. In both seasons in this latter period, the locus of greatest warming has been West Antarctica, and particularly the Ross Sea region and Marie Byrd land, not just the Antarctic Peninsula as virtually all studies prior to ours had assumed. This is an important result that we highlighted in our paper because it has implications for our understanding of the dynamics involving Antarctic warming. Specifically, we made a model-data comparison in the paper, in which we said
… both in the reconstruction and in the model results, the rate of warming is greater in continental West Antarctica, particularly in spring and winter, than either on the Peninsula or in East Antarctica…. This is related to SST changes and the location of sea ice anomalies, particularly during the latter period (1979–2003), when they are strongly zonally asymmetric, with significant losses in the WestAntarctic sector but small gains around the rest of the continent.
In other words, during the period where we have good sea ice data, areas with little sea ice are always areas of surface warming in the Antarctic. It was already well established before our work that sea ice anomalies play a major role in the observed waring on the Antarctic Peninsula’s west coast. Our work showed that this is also true in West Antarctica, and is fully confirmed by O’Donnell et al.’s analysis. The only point of disagreement is in winter, in the earlier part of the record only (prior to the satellite era).
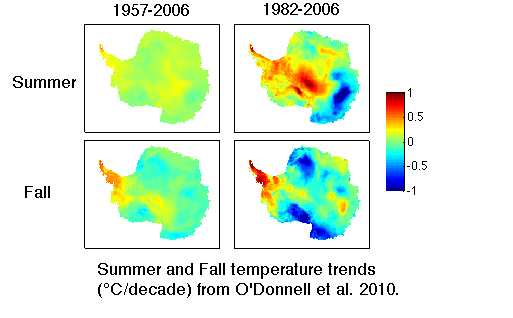 Another point of complete agreement between our results and O’Donnell et al. is that the most widespread cooling occurs in fall — not summer as discussed in earlier work (e.g. Thompson and Solomon, 2000). This may be something of a problem for the hypothesis that ozone depletion is a major driver of the observed East Antarctic cooling, because the forcing is occurring in spring (when the ozone hole develops). If there is a link between the spring forcing and fall temperature, it is not a simple one, but likely would include a role for sea ice, which offers an obvious source of persistence from season to season (a paper in review by Arnour and others argues exactly this point).
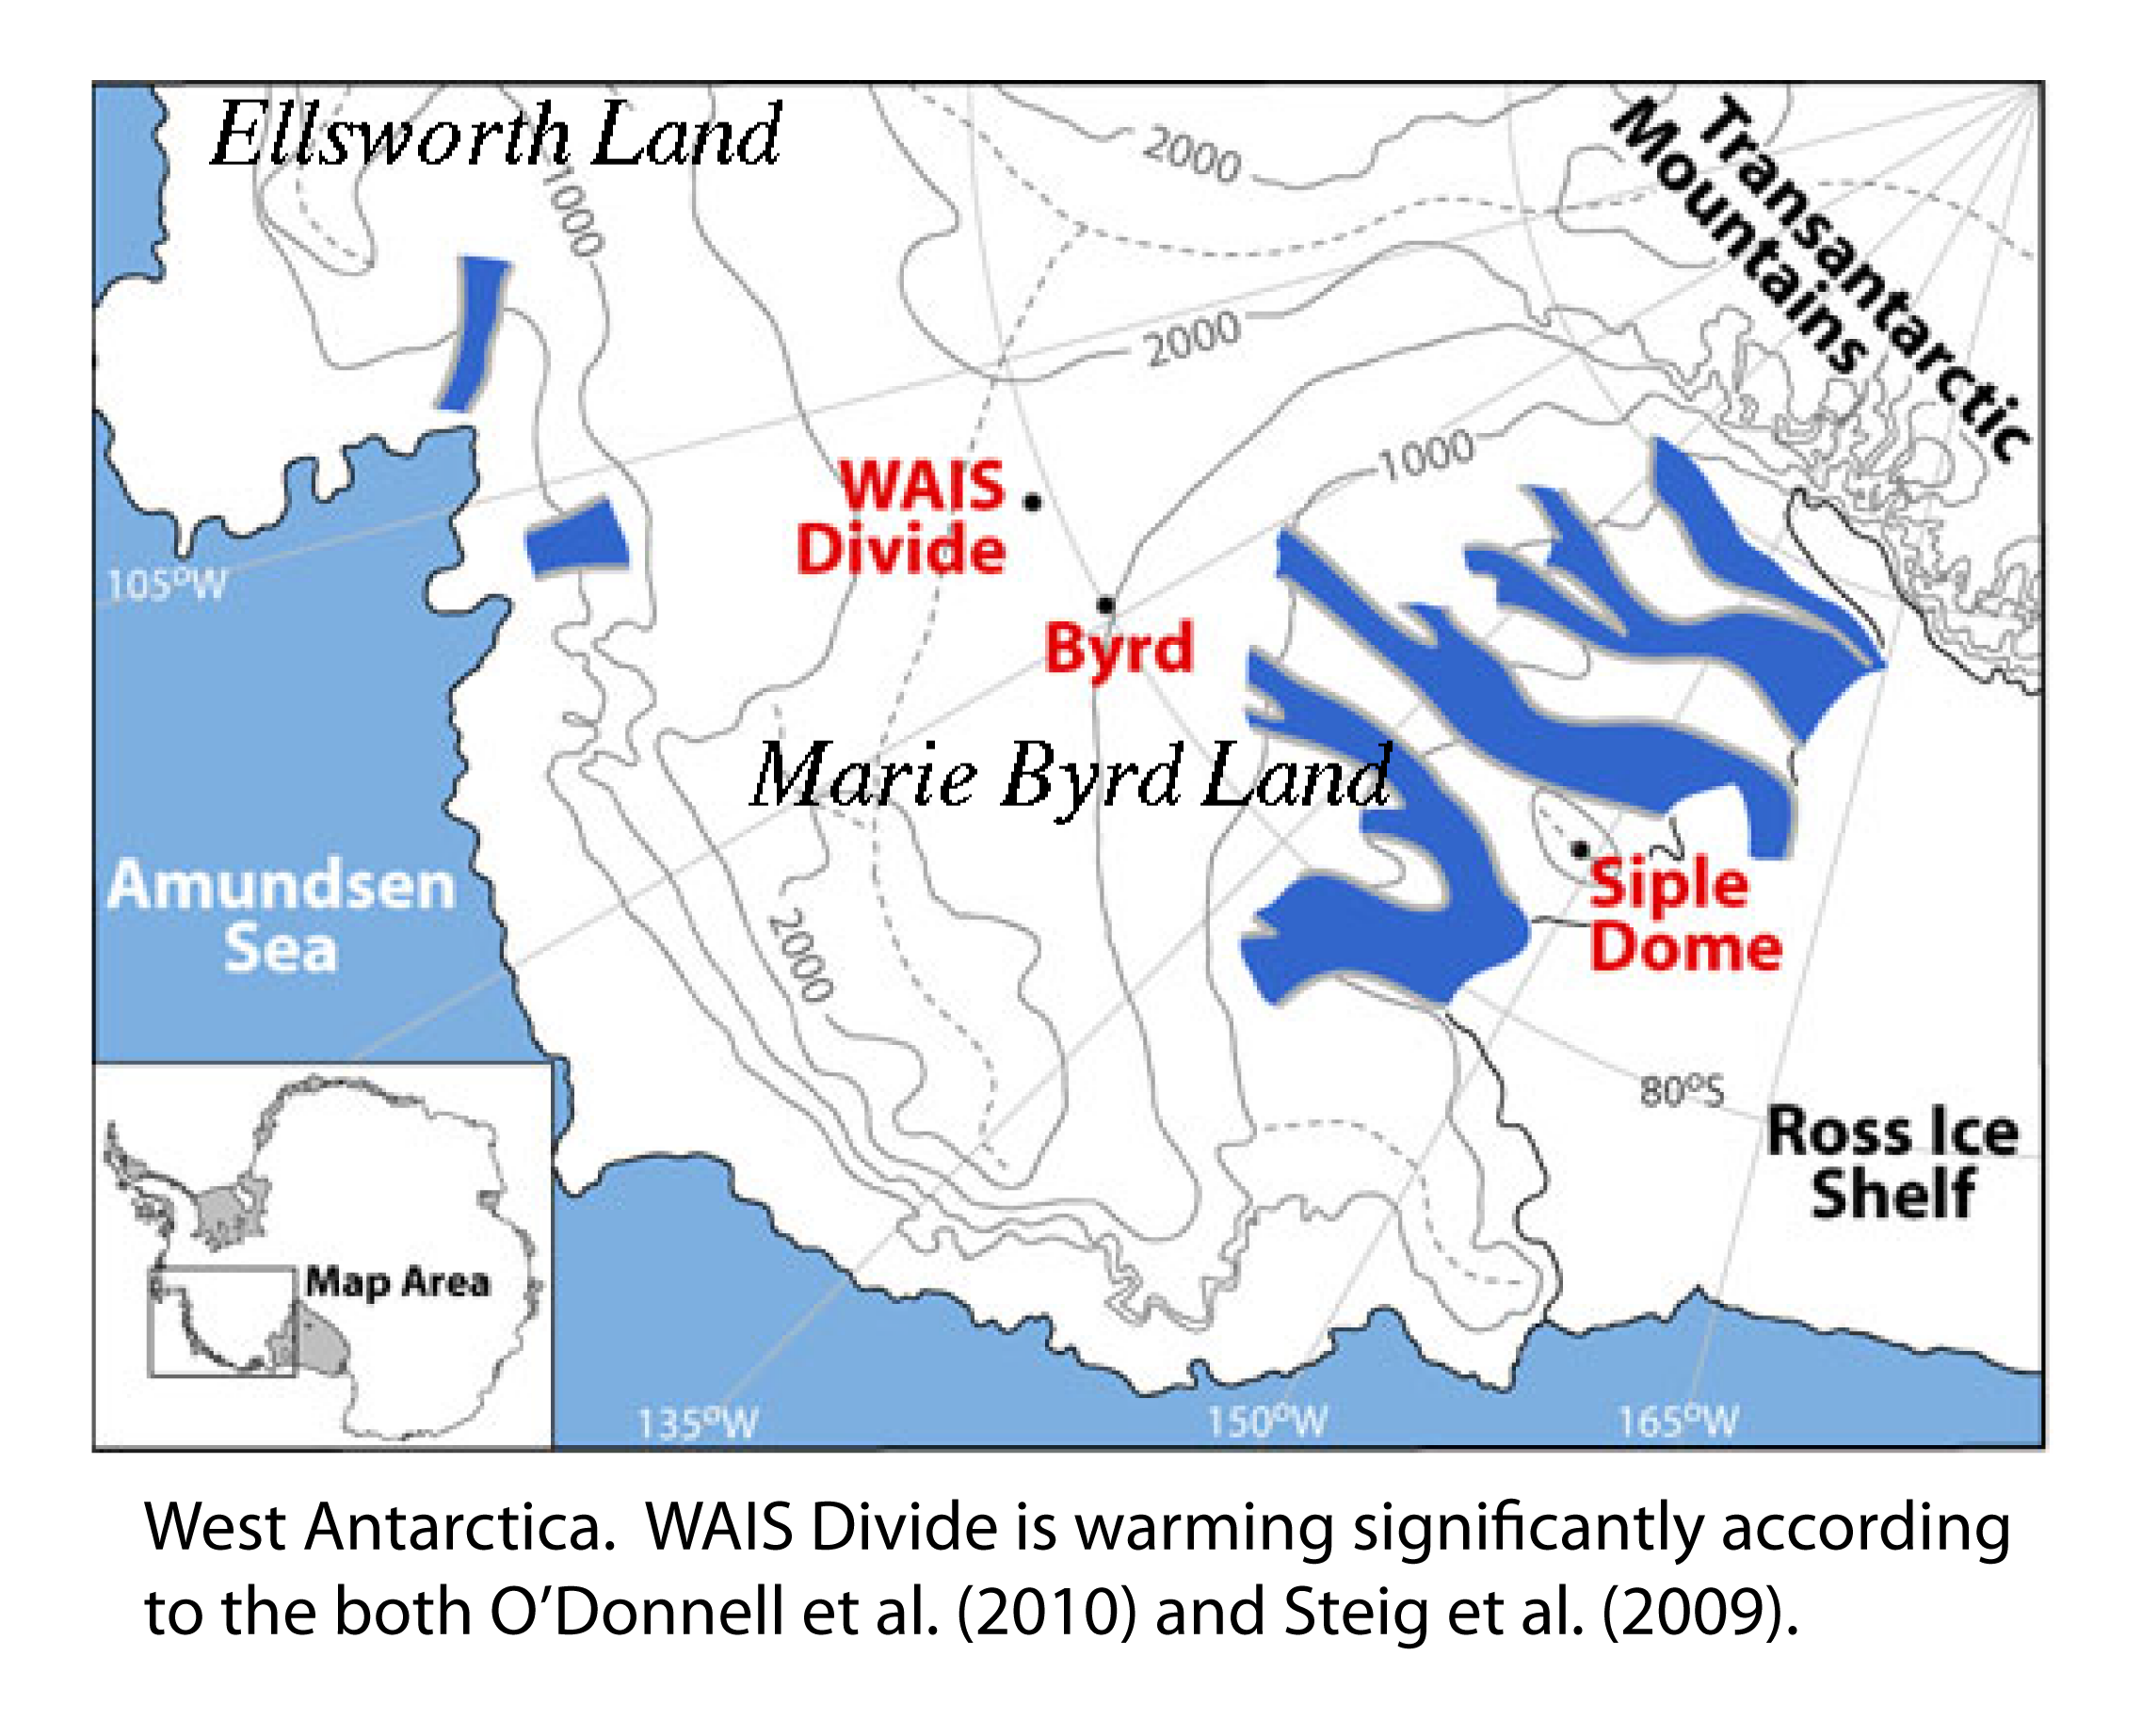
Finally, O’Donnell et al. agree with us on the most basic result of all: there is statistically significant warming in West Antarctica. In this context, it is worth being very clear on what is meant by “West Antarctica”. Reading what has been said about O’Donnell et al. in various places in the blogosphere, one would get the impression that their paper returns the warming of Antarctica to its ‘rightful’ place, the Antarctic Peninsula alone. If that were true, it would certainly be a significant refutation of our work. But in the actual abstract of O’Donnell et al., it is stated that “we find that statistically significant warming extends at least as far as Marie Byrd Land.” Marie Byrd Land is that part of West Antarctica that extends eastward from the Ross Ice Shelf up past Byrd Station and over the central West Antarctic Ice Divide (see the map above). In O’Donnell’s results, there is significant warming all the way from the Peninsula westward past WAIS Divide site, at 112°W, well within Marie Byrd Land and nowhere near the Antarctic Peninsula. Prior to our work, no one had claimed that any area outside the Peninsula was warming significantly. Borehole thermometry at WAIS Divide (Orsi and Severinghaus, 2010) and at the Rutford Ice Stream (closer to the Peninsula; Barrett et al,. 2009) has since provided completely independent validation of these results. O’Donnell et al. is thus merely the latest of several studies to confirm our original finding*: West Antarctica is warming significantly.
To be sure, there is real disagreement between our results and those of O’Donnell et al. For the full fifty year reconstruction of temperature trends, the main reconstruction they discuss in the paper shows cooling in the winter and fall over the Ross Ice Shelf, which contrasts with our finding of significant warming there. As a consequence, their overall warming trends are smaller, by about half. These are the only important differences between our results and those of O’Donnell. Nevertheless, they are significant differences, and certainly may be important for our understanding of Antarctic climate change. In particular both results would tend to suggest a greater role for natural variability than our findings implied. If O’Donnell et al.’s results are correct, this would suggest that the damped response of Antarctica to global radiative forcing (i.e. CO2 increases) that is commonly seen in models (as discussed previously by Spencer Weart, for example) is perhaps more on the mark than our paper would suggest (though note that even the much larger trends we estimated are still significantly damped compared with the Arctic.)
Let’s return now to the question of whether O’Donnell et al.’s results actually do represent an improvement over ours. The figure below indicates a rather glaring problem: O’Donnell et al. disagree markedly with the raw weather station data from Byrd, which is the only record of any length anywhere in West Antarctica. Shown in the figure, reproduced again below, are the main reconstructions of Steig et al. (2009) (green) and O’Donnell et al. (2010) (blue), compared with the the actual raw data (black) from the Byrd weather station. The simple linear trend on the raw data is nearly four times larger in reality than shown by O’Donnell et al., whereas it is not statistically distinguishable from Steig et al. There are a lot of missing data from Byrd (and annual means in the figure include some missing months), so also shown in the figure (dashed) is an independent infilling of missing data from Byrd station, done by Andy Monaghan (using no satellite data whatsoever, as described in Monaghan et al., 2008, plus new data available through 2009). The updated Monaghan estimate — currently under review — indicates an even higher trend, >0.4°C/decade, when the data are updated through 2009.
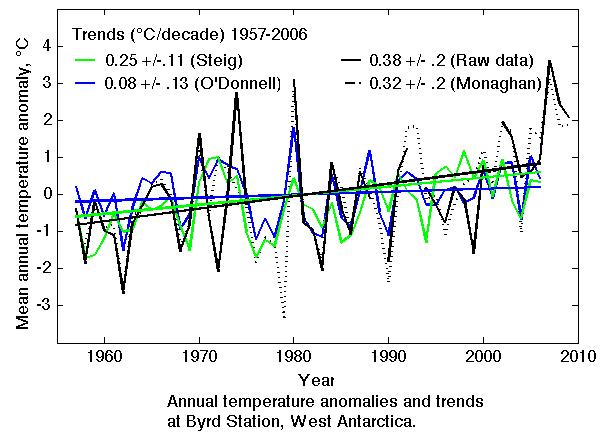
The evident failure of O’Donnell et al. to correctly capture what is going on at Byrd (and presumably elsewhere in West Antarctica) is quite surprising, given that one of key differences in their methodology is to use the weather station data — not the satellite data as we did — as the verification target. That is, O’Donnell et al. use weather stations, withheld one at a time from the reconstruction for verification purposes to optimize their calibration. How then, can they be so far off for the location of the most important weather station? (I say ‘most important’ here because the main point of contention is, after all, West Antarctica). There are three likely sources of the problem, each pertaining to O’Donnell et al. implementation of their suggested modifications to the method we used.
First, as I noted above, O’Donnell et al. use a linear combination of weather station data for their reconstruction, both in the reconstruction period (pre-1982) and in the calibration period (the satellite era, post 1981). This is a very reasonable thing to do, resulting in a more homogeneous data set than ours. However, it also means throwing out information that might be important: namely, that there are strong trends in the temperatures in West Antarctica that may not be captured by any weather station data. This is not a very large problem in East Antarctica, where the scale of spatial covariance is large, and the number of weather stations is also large; it is a potentially huge problem in West Antarctica, where the number of stations is small (again, only Byrd goes back beyond the satellite era) and the spatial scale of covariance is also smaller, due to the greater topographic relief. On top of that, O’Donnell et al. do not appear to have used all of the information available from the weather stations. Byrd is actually composed of two different records, the occupied Byrd Station, which stops in 1980, and the Byrd AWS station which has episodically recorded temperatures at Byrd since then. O’Donnell et al. treat these as two independent data sets, and because their calculations (like ours) remove the mean of each record, O’Donnell et al. have removed information that might be rather important. namely, that the average temperatures in the AWS record (post 1980) are warmer — by about 1°C — than the pre-1980 manned weather station record. Note that caution is in order in simply splicing these together, because sensor calibration issues could means that the 1°C difference is an overestimate (or an underestimate).** Since Steig et al. retained the satellite data, we didn’t need to worry about this. O’Donnell et al didn’t have that luxury, and should at the very least have considered the impact of treating Byrd Station and Byrd AWS as entirely independent records.
Second, in their main reconstruction, O’Donnell et al. choose to use a routine from Tapio Schneider’s ‘RegEM’ code known as ‘iridge’ (individual ridge regression). This implementation of RegEM has the advantage of having a built-in cross validation function, which is supposed to provide a datapoint-by-datapoint optimization of the truncation parameters used in the least-squares calibrations. Yet at least two independent groups who have tested the performance of RegEM with iridge have found that it is prone to the underestimation of trends, given sparse and noisy data (e.g. Mann et al, 2007a, Mann et al., 2007b, Smerdon and Kaplan, 2007) and this is precisely why more recent work has favored the use of TTLS, rather than iridge, as the regularization method in RegEM in such situations. It is not surprising that O’Donnell et al (2010), by using iridge, do indeed appear to have dramatically underestimated long-term trends—the Byrd comparison leaves no other possible conclusion.
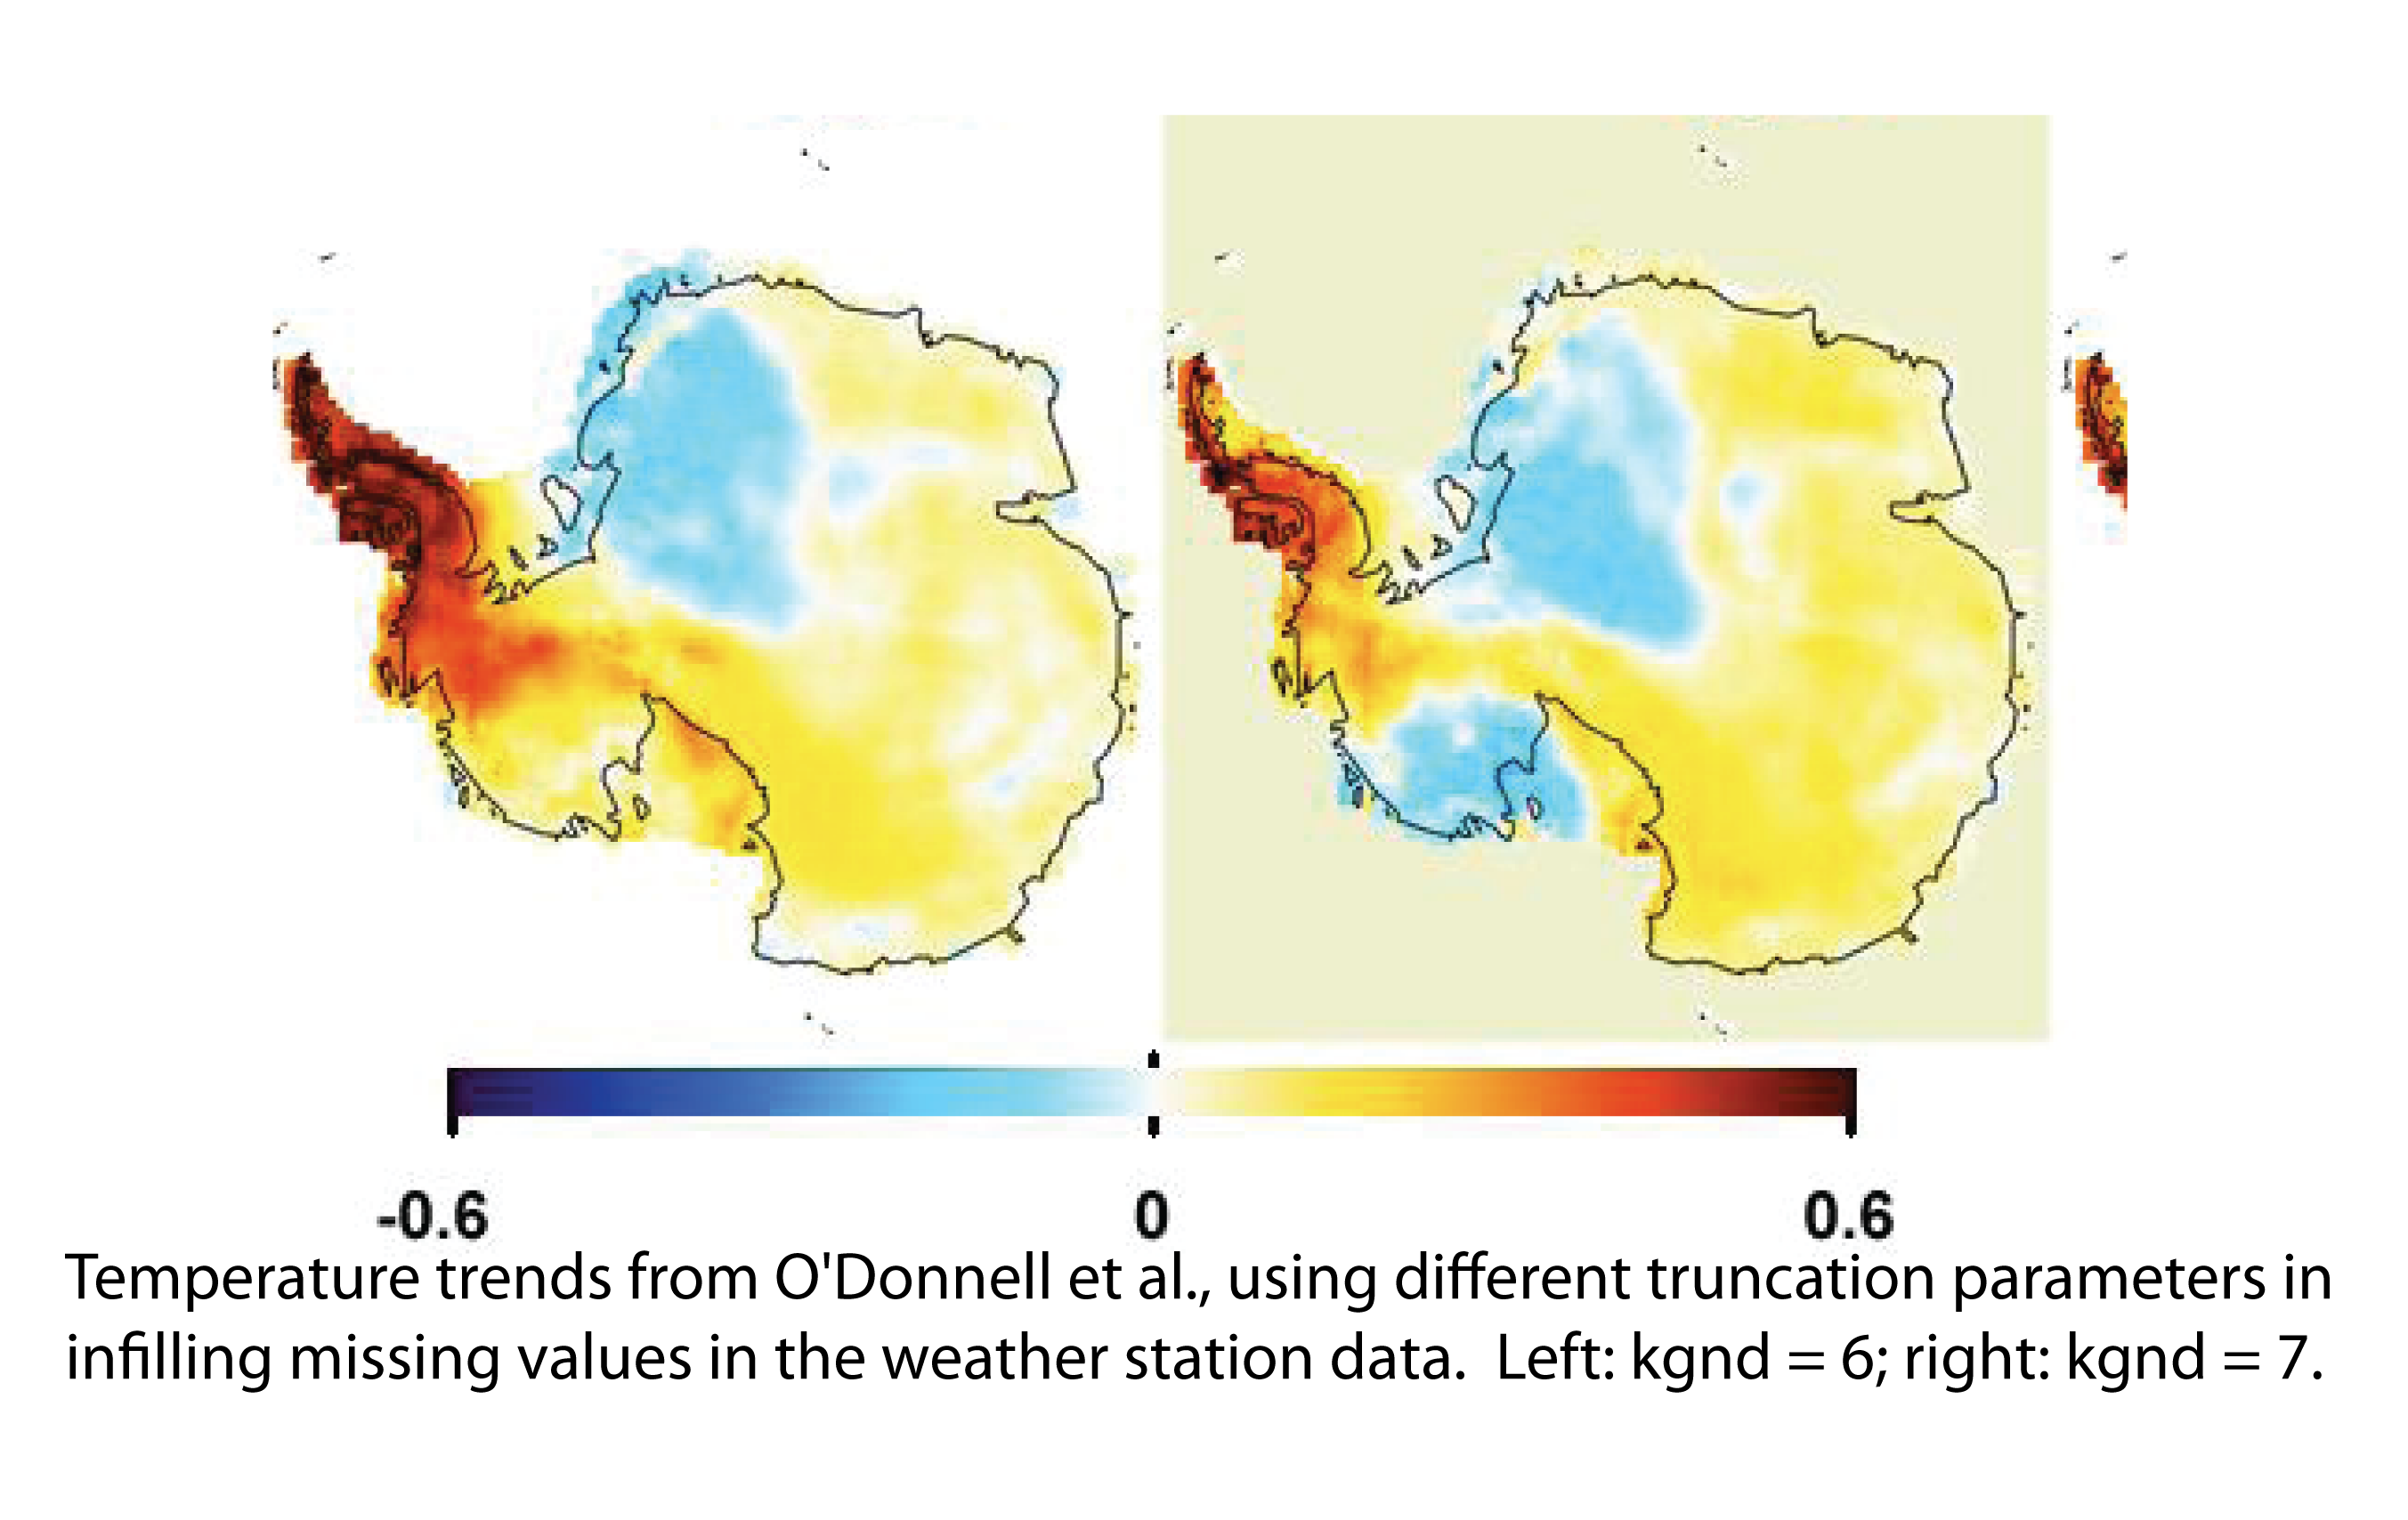 O’Donnell et al. do not rely entirely on ridge regression. They also present results from a more explicit cross-validation test, using various truncation parameters for a ‘truncated total least squares’ (or ‘truncated singular value decompositon’) regressions, as we did in our work. However, these tests, as implemented, are also problematic. O’Donnell et al. actually use cross validation in two steps: first, by filling in missing data in the weather station records and choosing the truncation value (kgnd) that yields the best overall verification statistics. Second, by reconstructing the entire spatial field with another truncation value, ksat. In both cases, the optimization is done on the basis of the entire data set; that is, the ‘best’ parameter depends on what works best on average both in data poor regions (e.g. West Antarctica) and data rich regions (e.g. East Antarctica and the Peninsula). The obvious risk here is that too high a truncation value will be used for West Antarctica. There is rather good evidence to be found in the Supplementary Material in O’Donnell that this is exactly what has happened. The choice of kgnd that yields the best agreement with the iridge calculations (which, remember, is already known to create problems) happens to be kgnd = 7, and it just so happens that this yields the minimum trends. In fact, O’Donnell et al. show in a table in their Supplementary Material that the mean trend for West Antarctica for smaller values of kgnd is more than twice (~0.2 °C/decade) what it is for their ‘optimum’ estimate of kgnd = 7 (~0.07°C/decade). Indeed, using any value lower than the one they choose to rely on largely erases any difference between their results and Steig et al., 2009. This simple fact — illustrated in the figure above (trends in °C/decade for 1957-2006) — has been notably absent in the commentaries that O’Donnell and coauthors have made about their paper.
Third, the way that O’Donnell et al. actually do the cross-validation to optimize ksat is itself pretty dodgy. Rather than using split calibrations (that is, comparing early period with late period statistics), they one-by-one withhold each weather station time series over the entire length of the record. To see the problem with this, consider what happens if you withhold the South Pole station record, which is complete for the entire time period, and then repeat the regressions to find the best truncation value for South Pole. For the period 1982-2006, when there are satellite data available for (and highly correlated with the station at) South Pole, the optimal number will be much higher (data richness) than during the pre-satellite era (data poor). The number that gets used will be an underfitting for the pre-satellite era and an overfitting for the satellite era. Note that ksat is actually the number of EOFs that get retained; since one needs many more of these to reconstruct the Peninsula properly, it is inevitable that they’ll wind up with more retained EOFs than we did; that doesn’t mean this is the right number for West or East Antarctica. O’Donnell et al. do report split calibration statistics as well, but this is not how they choose their optimal values.
Does all of this mean that I think O’Donnell’s results are all wrong? Certainly not. I think that they are right to have retained more EOF patterns than we did, though the main impact of this is only in capturing the strong Peninsula warming.*** It is also quite likely that O’Donnell et al.’s results are more accurate than ours for the satellite era, during which most of the problems I have discussed above are less likely to arise. Although their results show much smaller trends, they agree well with the spatial patterns in weather forecast reanalysis data products (NCEP2, ERA-40) during the satellite era. This is a nice, largely independent validation of those products, and suggests that it is okay to use those products — which include detailed information on atmospheric circulation changes, for example — for investigating the causes of the temperature trends. This is something that quite a few of us have been working on, but there has always been the nagging problem that we don’t really know how much we can trust NCEP and ERA products at high southern latitudes. O’Donnell et al. should certainly be cited in support of such work.
In summary, even if their results are taken at face value, O’Donnell et al. 2010 doesn’t change any of the conclusions reached in Steig et al. In West Antarctica where there is disagreement, Steig et al, 2009 is in better agreement with independent data, and O’Donnell et al.’s results appear to be adversely affected by using procedures known to underestimate trends. Thus while their results may represent an improved estimate for the trends in data rich regions — East Antarctica and the Peninsula — it is virtually certain that they are an underestimate for West Antarctica. This probably means going back to the drawing board to write up another paper, taking into account those suggestions of O’Donnell et al. that are valid, but hopefully avoiding their mistakes.
**There is, however, completely independent data from the WAIS Divide borehole, showing that this site has warmed by the same amount indicated by the Byrd weather station data — about 1°C since 1958. This is unpublished data, but the results were presented in an AGU talk and in the published abstract.
*** Peninsula warming was not the question we were addressing in our paper, as we made very clear in the text. We chose fewer EOFs based on our previous work (Schneider et al., 2004) showing that this sufficiently captures both East and West Antarctica.) Although retaining fewer EOFs reduces the spatial details, it is a conservative choice for estimating large-scale trends in both West and East Antarctica. See also our discussion on overfitting.
No comments:
Post a Comment